At the start of the 2024 political cycle, Donald Trump set his sights on winning his 5 states back — the trifecta of PA, MI, and WI that launched him into the White House plus GA and AZ which he lost narrowly in 2020.
And because Biden did better than him in the Electoral College (due to faithless electors), Trump’s Electoral College wish list also includes Minnesota, Nevada, New Hampshire, and maybe Virginia.
Well, Trump has no chance in the North Star State…and that’s even before the governor got on the ticket.1
Since 1932, Minnesota has gone Republican in presidential voting three times. Ike twice and Nixon in ‘72.
The only Republican who had a shot at winning the North Star State in the last 50 years was Ronald Reagan in ‘842 and he turned down the chance to win every state3 — too much respect for Fritz Mondale and he let Minnesota go Blue.
Donald Trump lost the state in 2016 and 2020. Closer the first time but definitely out of reach both times.
Guess what Hillary’s margin was in 2016?
She won by 1.51 percentage points which is less than the 2.1 percentage points she beat Trump by nationally in the popular vote. Still not that close. Her raw vote margin was 44,593. Comparably sized Wisconsin was much much closer (-22,748).
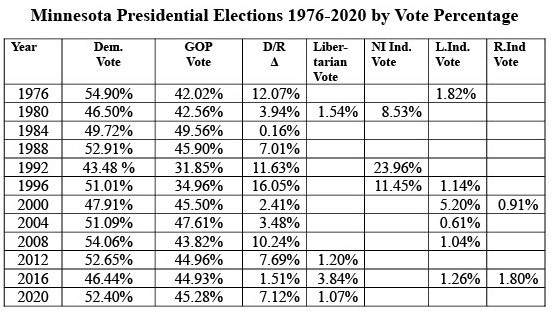
First, here’s the guide to the above.4
In 7 of the last 12 presidential elections, the Democratic candidate broke 50% of the vote in Minnesota. The average vote differential between the Democratic candidate for president and the Republican candidate was 9.09%.
In 1980, 1992, 2000, and 2016, third party voting skewed the voting. A lot. The average vote differential in these 4 contests - 4.87%.
Wait, Kevin, the Ross Perot vote percentage was huge in 1992 and 1996; what happens when you take the vote differentials out of the calculations?
The average vote differential for 1976, 1988, 2004, 2008, 2012, and 2020 was 7.93%. If 1984 is included, it’s 6.82%.
The average vote differential for 1980, 2000, and 2016 — 2.62%.
Let’s explore those three contests.
1980: John Anderson and Ed Clark. Two idealists. Anderson was, then, the ultimate idea man. Clark was the first serious and well financed Libertarian candidate. Anderson won 8.53% in Minnesota (well above his national average of 6.6%). Clark got 1.54% (which was also well above his national average of 1.06%).
In 1984, Reagan and Mondale got 99.33% of the vote, i.e. third party voting was near nil. In Minnesota, the Democratic ticket did 3.22 points better than 1980. The GOP did 6.80 points better. Anderson and Clark had pulled 9.08% of the electorate in 1980.
Everything broke the GOP’s way in 1984 and it still came up short. If Anderson had not caught so much national attention, the North Star State would have given the Democrats 50% rather easily in 1980.
2000: The Green Party caught a name with Ralph Nader. He drew 5.2% of the Left-leaning electorate in Minnesota and Pat Buchanan (running under the Reform Party banner) won 0.91%. Given the outcome in 2004, it’s not hard to extrapolate a 50% plus outcome without Nader’s candidacy.
In fact, the Democratic party average for these 12 contests is 50.25%. The Republican average is 43.27%. Take out those abysmal GOP numbers in 1992 and 1996, it goes up to 45.25%.
But let’s get to it.
2016: Hillary won the state with a purality.5 The Green Party won 1.26%. Evan McMullen took 1.80%. And the Libertarian Party took 3.84%.
Or did they? I have opined in my 2020 election analysis that Democratic-leaning independents voted Libertarian rather than support Hillary Clinton. She inured intense dislike. As a result, the Libertarian vote expanded well beyond its ideological base and overperformed.
The Libertarian vote in Minnesota was 1.2% in 2012 and 1.07% in 2020. Let’s assume, the true Libertarian vote in 2016 was 1.13% (a bit less than the average of the two). That puts 2.71% in likely Democratic hands.
Stack Trump’s 44.93% plus McMullen’s 1.80% together — that’s 46.73%. Nearly 1.5 points better than he did in 2020 (actually 1.45 points).
Stack Hillary’s 46.44 plus the Green Party’s 1.26% — 46.70%. Razor thin close to Trump’s numbers.
Except, you have to allocate that 2.71% to either Hillary or Trump. And you have to give it to her.
Why? Trump’s stacked 2016 numbers are too high given how he actually did in 2020. Trump’s 2020 percentage and Romney’s 2012 performance more or less put a pin in the notion that Minnesota is or was winnable for Trump.
And Biden’s win in Minnesota more or less underscores the above. He did nearly 6 points better than her.
BTW: If you add the 2.71% to Hillary’s stacked 2016 numbers — it only gets her to 49.41%. Even Fritz Mondale beat that.
Photo and image from Fast Company
https://en.wikipedia.org/wiki/1984_United_States_presidential_election
The last president to win every state was James Monroe. Ran unopposed and won all 23 states.
NI (non-idelogical) Independent vote. In 1980, it was John Anderson. In 1992 and 1996, it was Ross Perot.
L.Ind is Left Independent Third Party and R.Ind is Right Independent Third Party.
If a Libertarian or other Third Party Candidacy failed to get at least 0.50%, I left it blank.
This is a great NPR piece that was published before 2020. It backs up much of my analysis here. https://www.mprnews.org/story/2020/10/28/behind-the-mn-numbers-what-election-2016-says-about-2020


